
Pregunta de Natural Sciences and their Technologies #019e354b
A saúde do professor: acústica arquitetônica
Dentre os parâmetros acústicos que afetam a inteligibilidade dos sons emitidos em ambientes fechados, destacam-se o ruído de fundo do ambiente e o decréscimo do nível sonoro com a distância da fonte emissora. Assim, sentar-se no fundo da sala de aula pode prejudicar a aprendizagem dos estudantes, por impedir que eles distingam, com precisão, os sons emitidos, diminuindo a inteligibilidade da fala de seus professores. Considere a situação exemplificada pelo infográfico: à distância de 1 metro, o nível sonoro da fala de um professor é de 60 dB e diminui com a distância. Considere, ainda, que o ruído de fundo nessa sala de aula pode chegar a 45 dB e que, para ser compreendida, o nível sonoro da fala do professor deve estar 5 dB acima desse ruído.
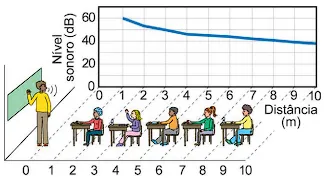
For a given maximum background noise level, the greatest distance a student can be from the teacher and still understand their speech is closest to
3.0 m.
4.5 m.
6.5 m.
8.0 m.
9.5 m.
Explicación Oficial / Explicaciones de la Comunidad
Analysis of Speech Intelligibility in the Classroom
The correct answer is option A. A) 3.0 m.
1. Defining the Limit of Comprehension
The statement establishes two crucial conditions for a student to be able to understand the teacher's speech:
- The maximum background noise level in the room is 45 dB. 2. To be understood, the teacher's speech must have a sound level of at least 5 dB above of that noise.
Based on this, we can calculate the minimum sound level that the teacher's speech should have when it reaches the student:
- Minimum Sound Level = Background Noise + Required Increase * Minimum Sound Level = 45 dB + 5 dB = 50 dB
Therefore, the task is to find the greatest distance at which the sound level of the teacher's speech is still equal to or greater than 50 dB.
2. Interpreting the Graph
The provided graph relates to Distance from the sound source (X-axis, in meters) to the Sound Level perceived (Y-axis, in decibels). The descending curve shows, as expected, that the sound becomes weaker (lower sound level) as the distance increases.
3. Locating the Distance on the Graph
Now, we use the value we calculated (50 dB) and locate it on the graph:
- Find the value 50 dB on the Y-axis (Sound Level). 2. Draw a horizontal line from 50 dB until it intersects the blue curve. 3. From the point of intersection on the curve, draw a vertical line down to the X-axis (Distance).
In doing so, we observe that: * At a distance of 2 meters, the sound level is approximately 54 dB (above 50 dB, therefore understandable). * At a distance of 3 meters, the sound level is approximately 48 dB (below 50 dB, therefore incomprehensible).
This means that the exact point where the sound level is 50 dB is located between 2 and 3 meters, but visibly much closer to the 3-meter mark.
4. Conclusion
The greatest distance a student can be from the entrance and still receive sound at a minimum of 50 dB is slightly less than 3 meters. Among the options provided, the value... closest at that maximum distance is 3.0 m.