
Pregunta de Natural Sciences and their Technologies #019e354b
Um dos agentes que mais contribui para a poluição do ar é o automóvel a combustão interna. Em áreas urbanas, isso é demonstrado dramaticamente pela fumaça fotoquímica, resultante da interação entre óxidos de nitrogênio, hidrocarbonetos e luz solar, para formar produtos de oxidação, que causam irritação aos olhos, ao aparelho respiratório e danos às plantas. As condições de operação de motores a combustão, como a razão da mistura ar/combustível no cilindro, influenciam na composição dos gases lançados pelo escapamento na atmosfera. O gráfico ilustra a variação nas composições dos principais gases, dióxido de carbono (CO2), hidrocarbonetos (HC), monóxido de carbono (CO), monóxido de nitrogênio (NO) e oxigênio molecular (O2), emitidos por um motor a gasolina, em diferentes razões ar/combustível, em massa.
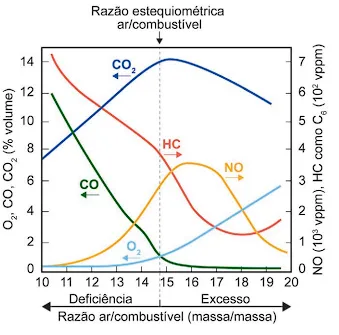
Under conditions of an air/fuel ratio equal to 18, there will be an emission
Low O2 and high NO.
Low NO and high HC.
Low CO2 levels and high CO2 levels.
Low HC and high CO.
Low CO2 and high HC.
Explicación Oficial / Explicaciones de la Comunidad
Analysis of Combustion Engine Gas Emissions
The correct answer is option A. C) Low CO and high CO₂.
1. Problem-solving strategy: Reading the graph
The question asks to analyze the emissions of different gases under a specific condition: a air/fuel ratio equal to 18To solve this, simply locate this value on the horizontal axis (X-axis) of the graph and observe the levels of the corresponding curves at that point.
2. Analysis at Air/Fuel Ratio = 18
- Locate the Point: Find the number 18 on the X-axis ("Air/Fuel Ratio"). 2. Draw a vertical line: Imagine or draw a vertical line upwards from point 18. 3. Observe the intersections: See where this vertical line intersects each of the colored curves that represent the gases.
Let's analyze the gases mentioned in the options at this specific point:
-
CO (Carbon Monoxide - green curve): Upon reaching a ratio of 18, the green CO2 curve has already plummeted and is at its minimum level, very close to zero. Therefore, the emission of CO is low.
-
CO₂ (Carbon Dioxide - blue curve): At a ratio of 18, the blue CO₂ curve is at a high level, around 12% by volume. Although it has passed its peak (which occurs near the stoichiometric ratio), it is still a very high value compared to other pollutants. Therefore, the emission of CO₂ is high.
-
HC (Hydrocarbons - red curve): The red curve of HC is at one of its lowest points at a ratio of 18. Therefore, the emission of HC is low.
-
NO (Nitrogen Monoxide - orange curve): The orange curve for NO has already passed its peak (which occurs around 16) and is declining. Therefore, its emission is moderate, but not high.
-
O₂ (Molecular Oxygen - light blue curve): The O₂ curve is rising, indicating a moderate level of unconsumed oxygen, as there is excess air in the mixture.
3. Evaluation of Alternatives
Based on the previous analysis, let's examine the options:
- A) Low O₂ and high NO: Incorrect. Oxygen emissions are moderate/high, and NO emissions are declining. * B) Low NO and high HC: Incorrect. HC emissions are low. * C) Low CO₂ and high CO₂: Correct. CO emissions are very low, while CO₂ emissions are high. * D) Low HCl and high CO2: Incorrect. CO2 emissions are low. * E) Low CO₂ and high HC: Incorrect. CO₂ emissions are high and HC emissions are low.
4. Conclusion
A direct reading of the graph at the point corresponding to an air/fuel ratio of 18 unequivocally shows very low emissions of carbon monoxide (CO) and high emissions of carbon dioxide (CO₂).